Product Analytics
Find out which products carry your store and which ones gather dust. Crate's Products report ranks your top sellers, surfaces slow movers, and flags everything that's out of stock — for any period you choose.
The Products report tells you where your money is really being made. Instead of guessing which lines to reorder or discount, you get three ranked lists and four summary tiles drawn straight from your real sales and stock.
The summary tiles
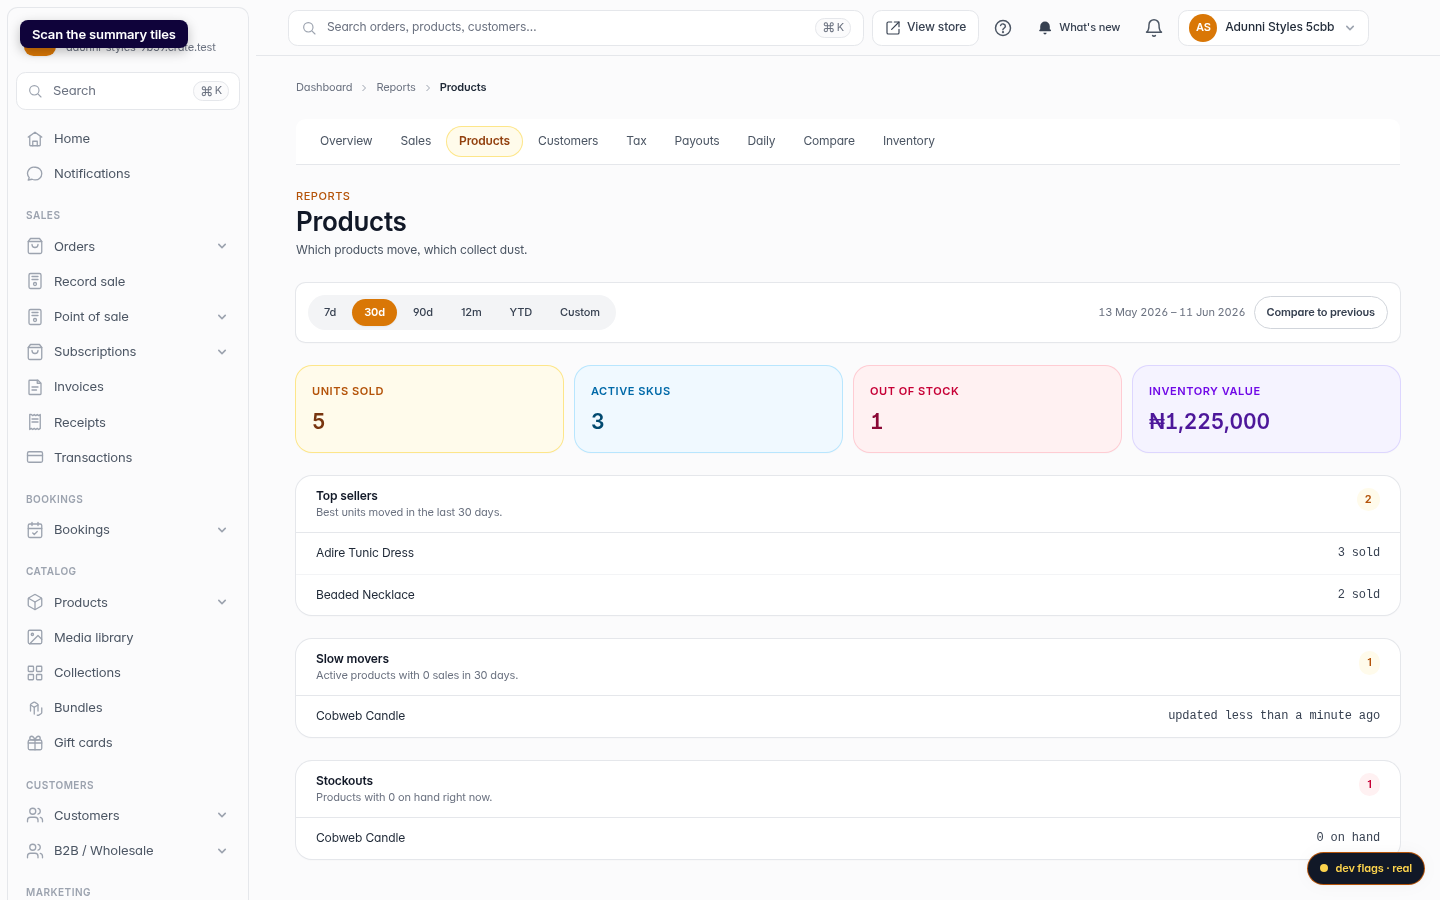
- Units sold — total quantity moved across completed orders in the period.
- Active SKUs — how many live products are in your catalogue.
- Out of stock — distinct products sitting at zero on hand right now.
- Inventory value — your on-hand stock valued at its selling price, so you can see how much capital is tied up on the shelf.
The three lists
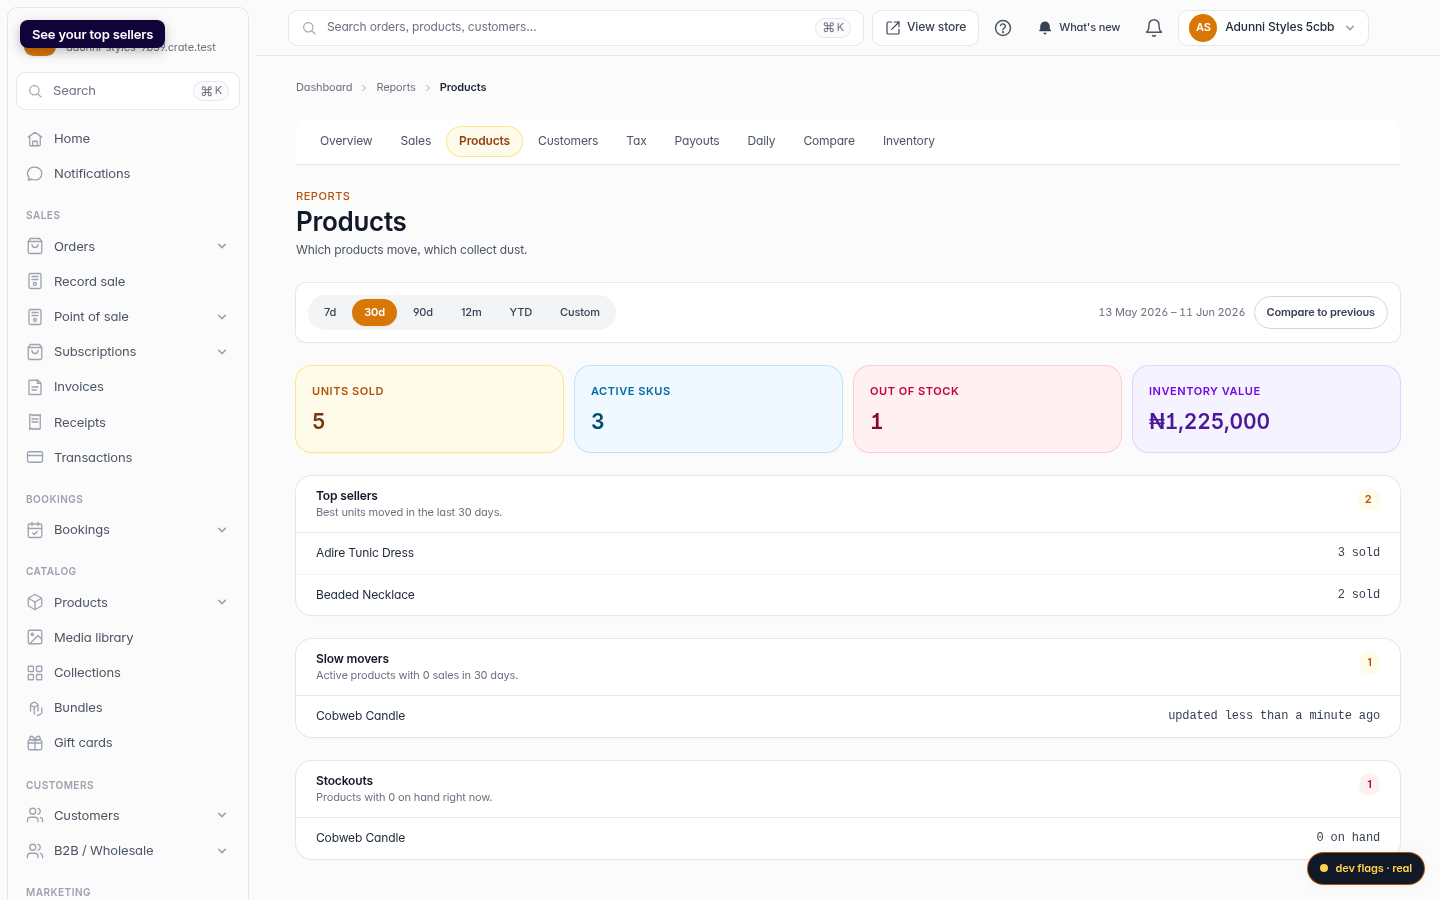
Top sellers ranks products by units moved in the chosen period, with the quantity shown beside each name. This is the list to act on first — restock the winners and give them pride of place in your store.
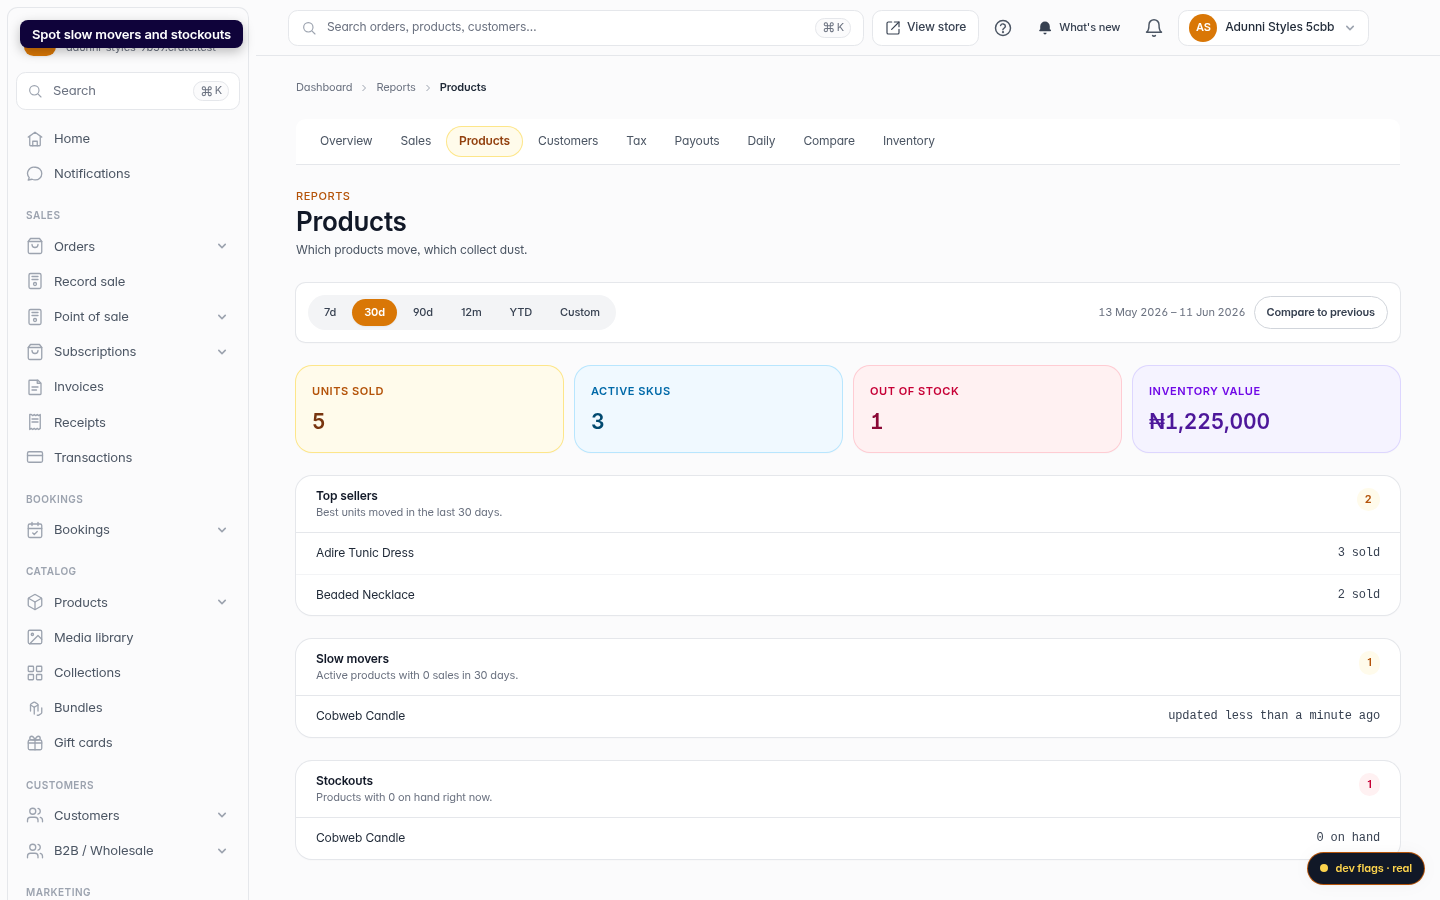
Slow movers surfaces active products that sold nothing in the period, along with when each was last updated. These are your candidates for a discount, a better photo, or quietly retiring.
Stockouts lists everything at zero on hand. Anything here is a sale you can't make until you restock — clear it fast.
Tip: Read Top sellers and Stockouts together. A best-seller that's also out of stock is your most urgent reorder.
Choosing a period
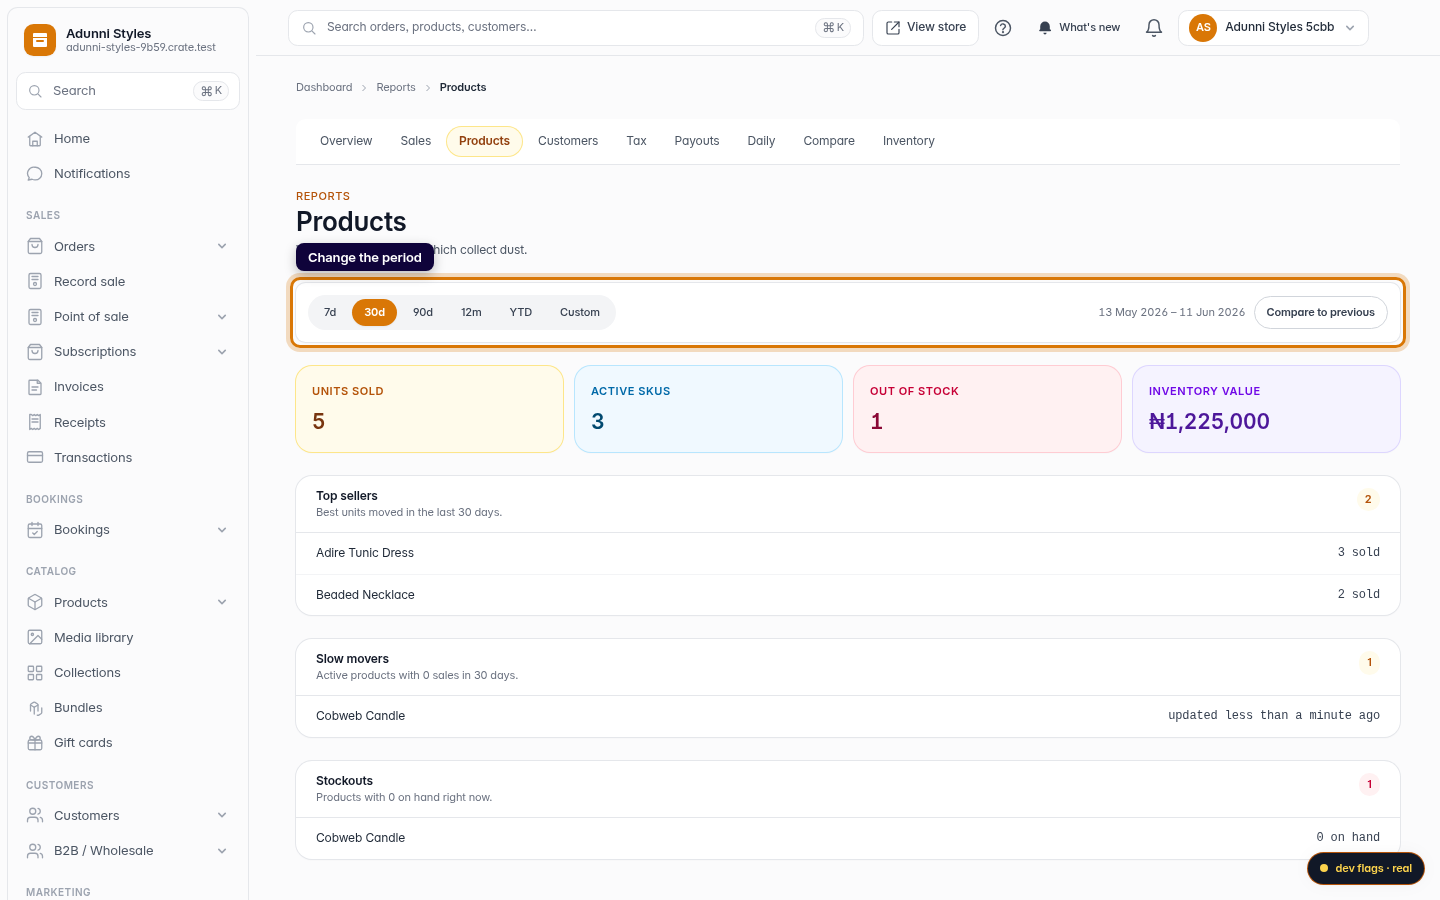
The period chips re-rank all three lists and recompute the tiles at once. Switch to YTD for the big picture, or 7d to see what's hot this week. Pick Custom to measure a specific promotion window, set the dates, and click Apply — the view updates and stays put if you bookmark or share the link.
-
1
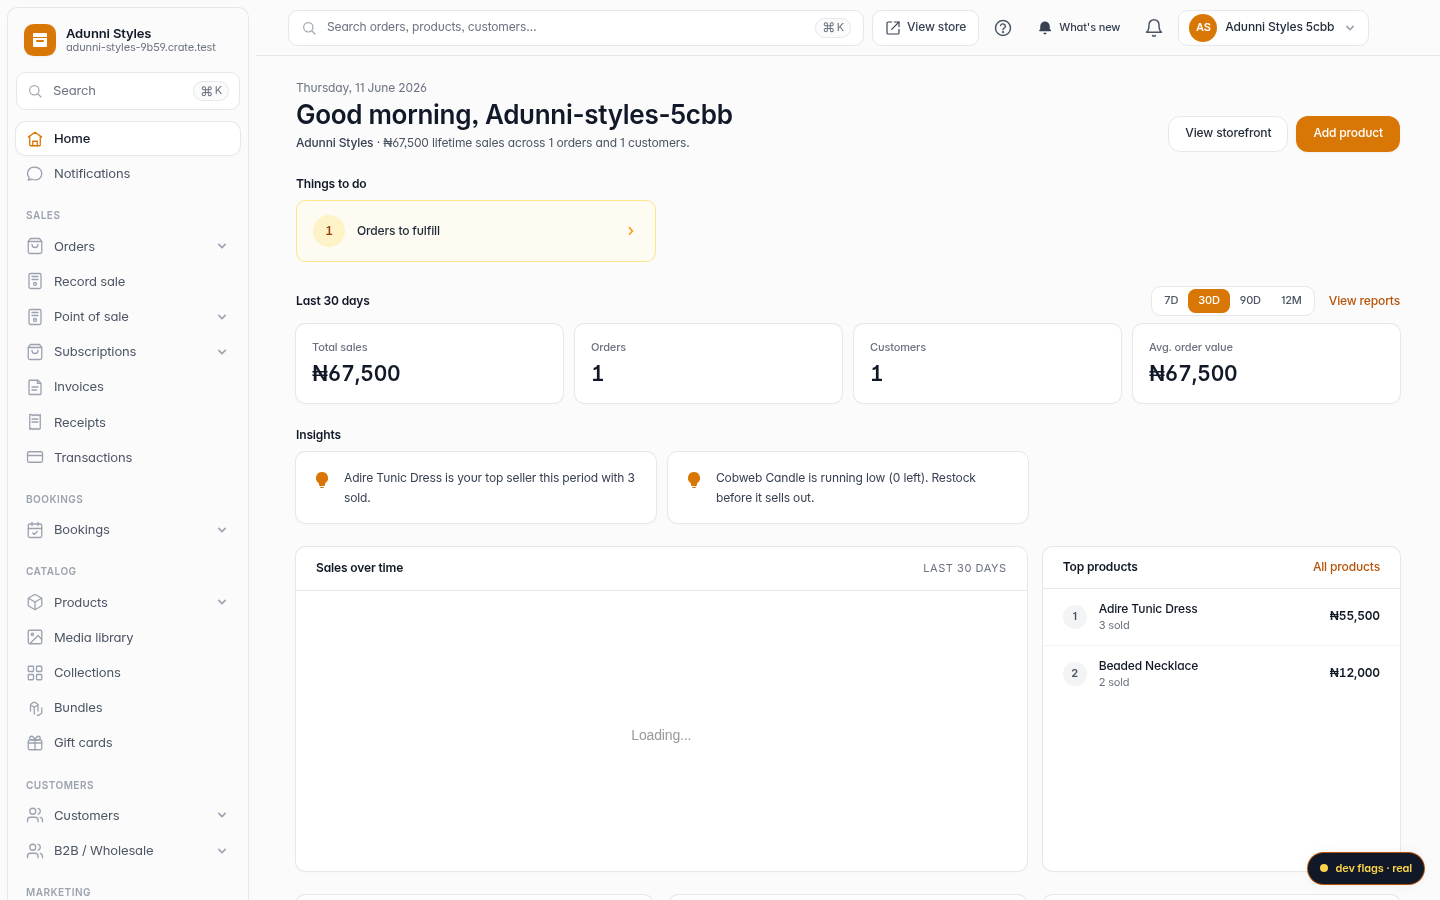
Open Reports
From your Crate dashboard, open Reports in the left sidebar.
Web -
2
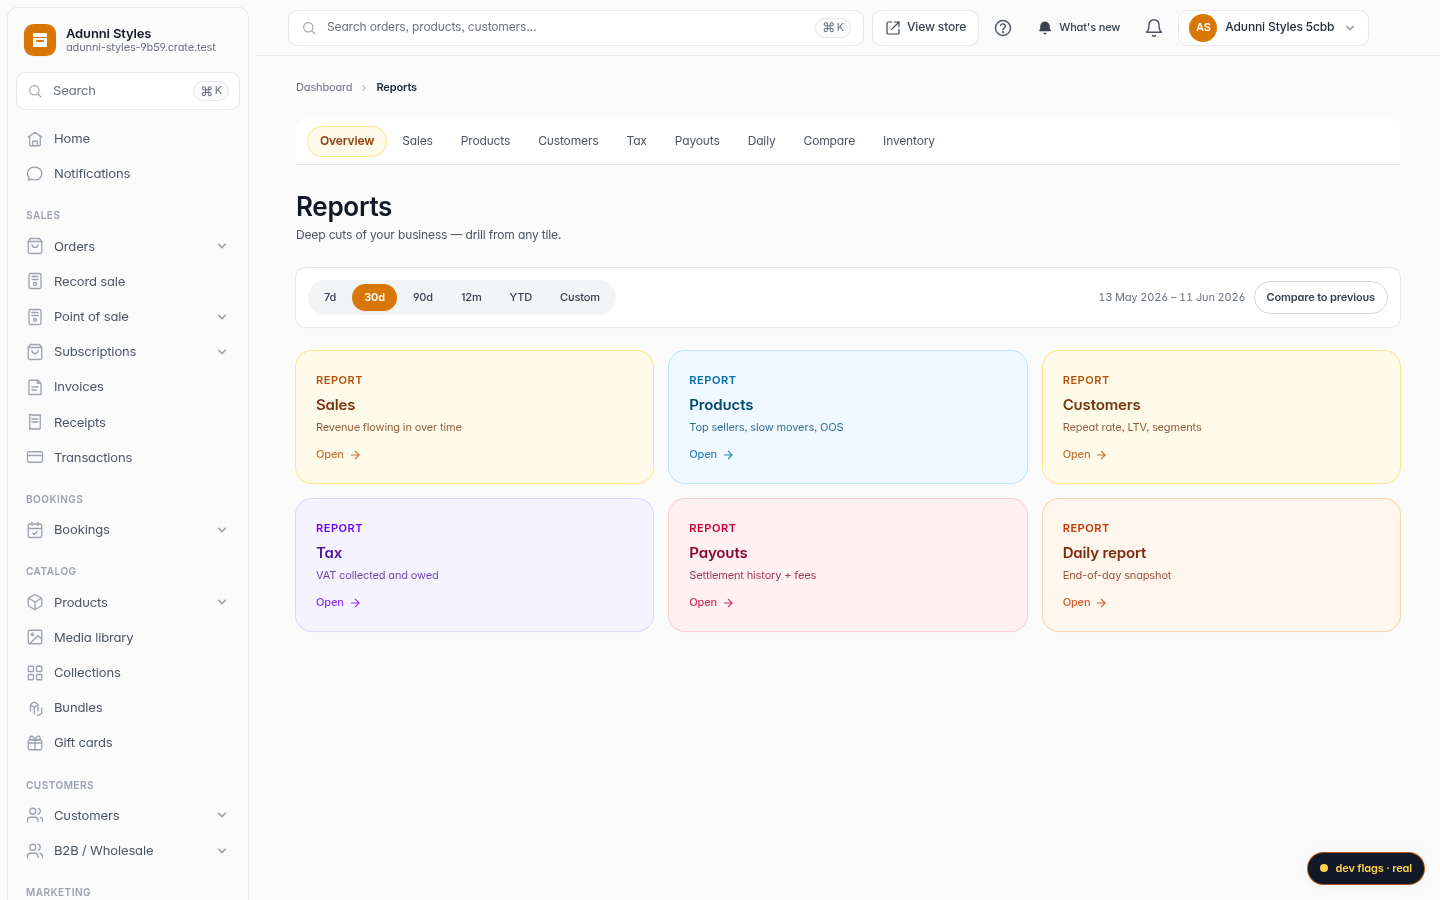
Open the Products report
In the Reports sub-nav, click Products. This is your product performance view.
Web -
3
Scan the summary tiles
The top row sums up your catalogue for the period: Units sold, Active SKUs, Out of stock and Inventory value (on-hand units priced at their selling price).
Web -
4
See your top sellers
The Top sellers list ranks products by units moved in the period, with the quantity sold beside each one — so you know what to restock first and what to feature.
Web -
5
Spot slow movers and stockouts
Slow movers lists active products with no sales in the period (and when each was last touched), and Stockouts flags everything sitting at zero on hand right now.
Web -
6
Change the period
Use the period chips — 7d, 30d, 90d, 12m, YTD or Custom — to re-rank every list for the window you care about.
Web