Sales over time
What you sold today, this week and this month, in US dollars.
See your best sellers, your top customers and the channels bringing the most orders. Real numbers in US dollars, on one dashboard, so you can decide what to stock, who to look after and where to sell next.
14-day free trial. No card required.
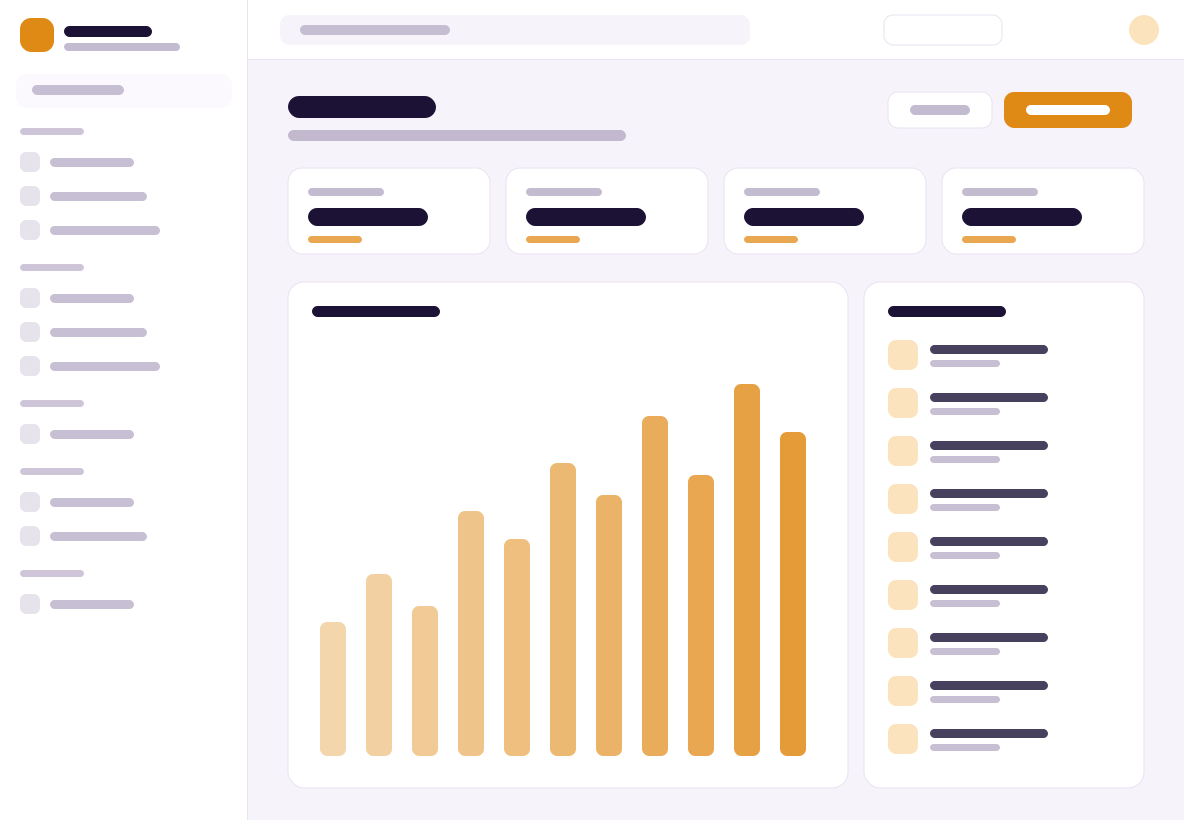
Crate reports what sold, who bought it and which channel the order came from. A Crate dashboard shows sales over time, best-selling products, top customers and the channels bringing the most orders, in the merchant's own currency, USD in the United States and NGN in Nigeria. Those figures come from the business's own orders in Crate rather than from an estimate or a sample. Crate reports across the online store, Instagram, WhatsApp and the counter together, because a business selling in four places needs one total rather than four. Crate analytics is read on a phone as readily as on a desktop. Crate publishes no benchmark against other merchants.
Every figure here is built from your own orders. There is no sample, no estimate and no benchmark against other merchants.
What you sold today, this week and this month, in US dollars.
Products ranked by units and by revenue, so a cheap fast mover and a slow high-margin piece both show their real worth.
Who spends the most with you, and when they last ordered.
Which of your channels is actually bringing the orders.
Every order you take is already counted, so the dashboard is right the first time you open it.
The same numbers, laid out for the screen you actually check them on.
Reporting is worth reading when a decision depends on it this week.
Best sellers by units and by revenue answer that question without a spreadsheet export.
The channel view says which one earns its time, rather than which one feels busiest.
Top customers by spend is the list you message before a new drop goes public.
No install, no connector, no tracking code to paste.
Set up from a phone. No developer, no plugin to buy, nothing to install.
Crate is one system rather than a shelf of add-ons, so these are the parts of it this page touches most.
The same capability, described in the language of the trade it is being used in.
No. Every order you take is already counted, so the dashboard is right the moment you open it. There is nothing to install, connect or export.
Your products ranked by how much they sell, both by units and by revenue in US dollars. A cheap fast mover and a slow high-margin product each show their real worth.
By how much each customer has spent with you, in US dollars, across their orders. It shows who to look after with a message or an early look at new stock.
Yes. Orders from your store, from Instagram, from WhatsApp and from in-person sales are all counted together, and the channel view shows where they came from.
Your own. Revenue, best sellers and top customers are all shown in US dollars, the same currency you buy stock and take payment in.
Best sellers, top customers and best channels, built from your own orders. Free for 14 days, no card required.
Start free